You Know the Numbers
Exist. You Just Can't See Them.
Revenue leakage, aging WIP, partner-level realization gaps — the data is already in your systems. We engineer the infrastructure that makes it visible, measurable, and actionable. The result isn't another dashboard — it's clarity on where the money's going, while there's still time to act.
Three Things Costing You Real Money
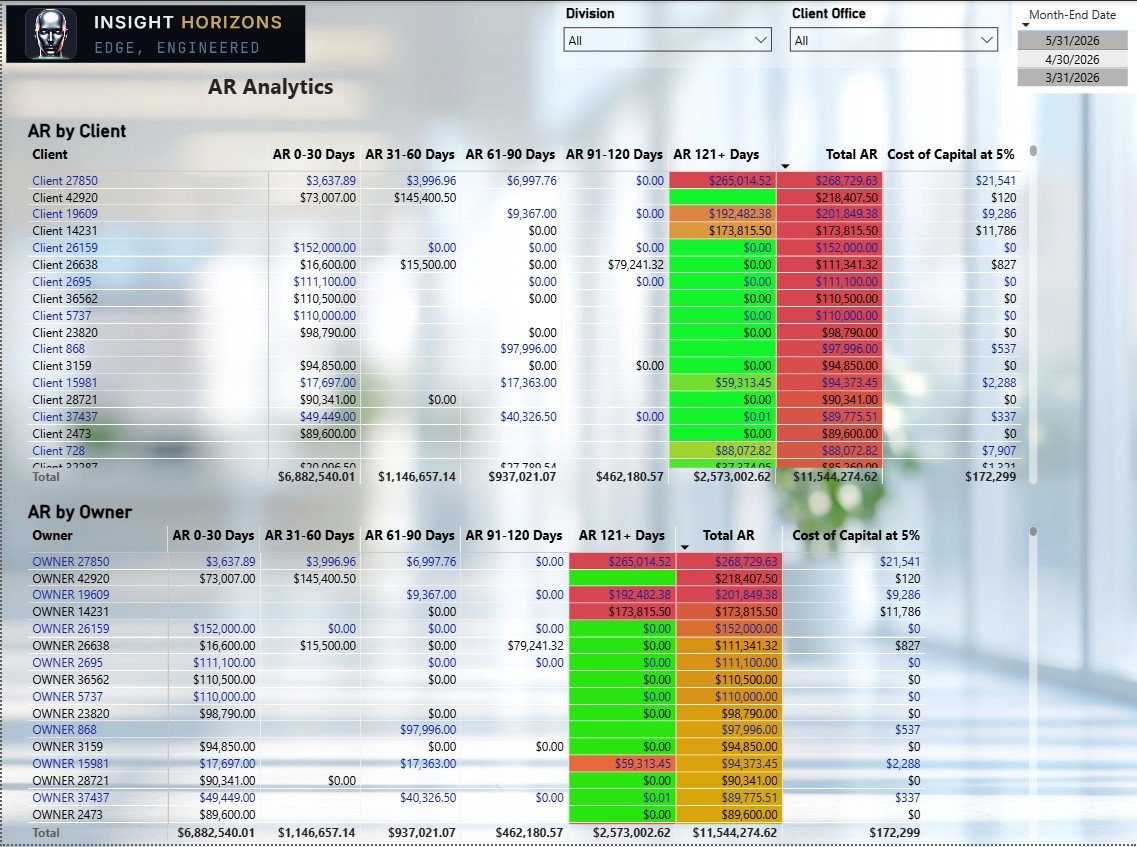
Ten million dollars sitting in receivables, nearly half of it severely delinquent. Without granular visibility into which clients, partners, and engagement types are driving the aging, collections strategy is a guessing game — and the cost of capital compounds every month.
Four million dollars a year written off before it ever reaches the bank. Firm-wide realization looks survivable at 83% — until you decompose it by partner, by engagement type, by client segment. That's where you find the structural leaks that no one is managing.
Three separate admin staff spending half their month assembling reports by hand in Excel — copying data, fixing broken formulas, reconciling numbers that don't match. The reporting process itself has become a cost center that produces stale answers.
That's $14 million in trapped capital and write-downs, plus six staff-weeks a month burned on manual reporting. If those numbers feel familiar, we should talk.
Schedule a ConversationYears of partnering with mid-market firms have shown me first-hand what usually hurts — and how to drag it into the unforgiving light of day.
The blind spots repeat from firm to firm: realization that erodes a point at a time, WIP that quietly ages into write-downs, receivables nobody's watching until the cash is gone. I know where to look because I've seen the same leaks surface again and again — and I know how to make them impossible to look away from.
That's the difference. Plenty of analytics shops can build a dashboard. Far fewer have spent years close enough to how a firm actually runs to know which numbers a managing partner needs by Monday morning, which ones quietly lie, and exactly where the money leaves without anyone seeing it go.
Insight Horizons exists to bring those things into the light. I don't sell software. I find where your firm is leaking, make it impossible to ignore, and hand leadership a decision they couldn't make the week before.
The Executive Command Center
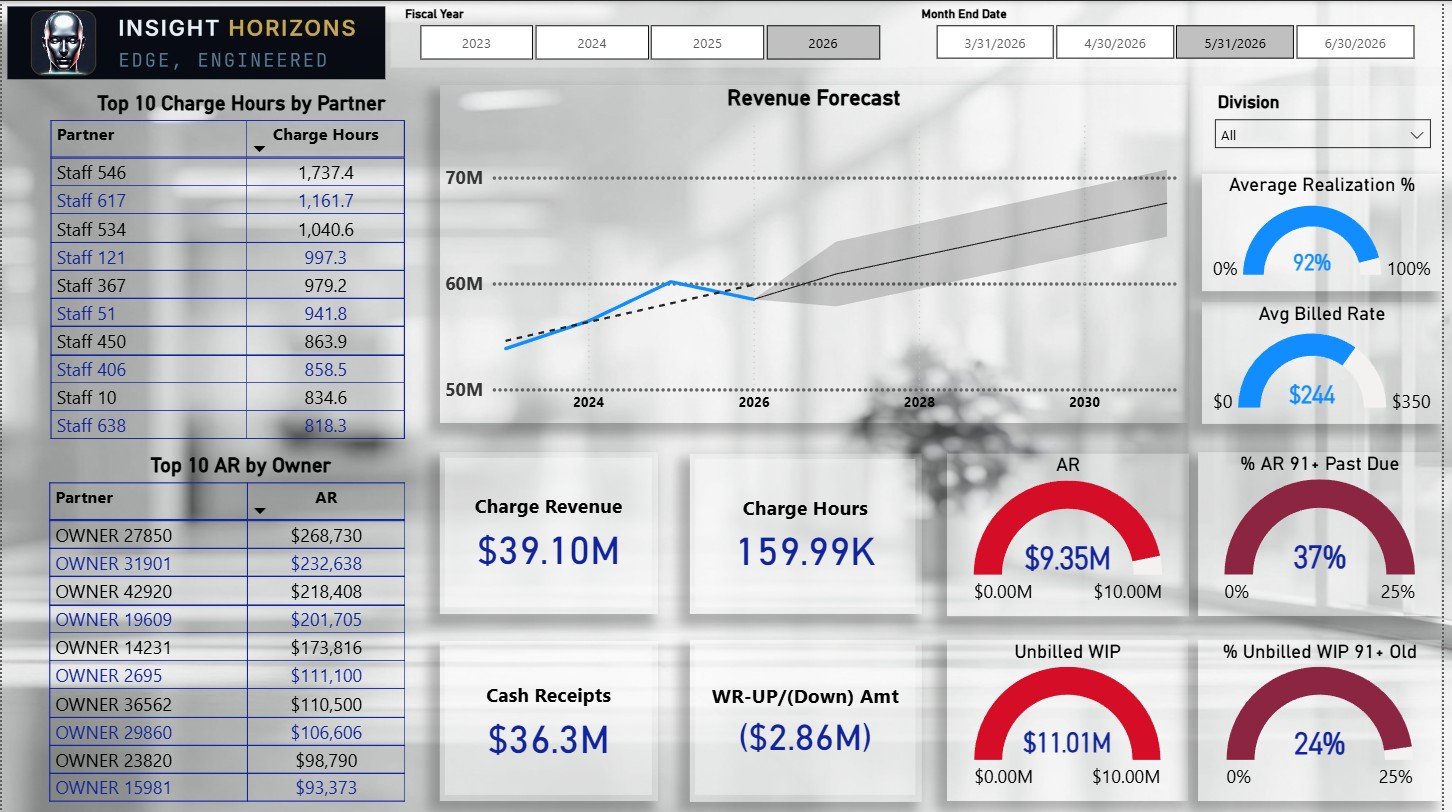
The screen a managing partner opens on Monday and knows, in thirty seconds, where the firm stands — and where it's bleeding. Built for a professional services firm, filterable by division, updated daily.
What's Lurking Behind the Curtain
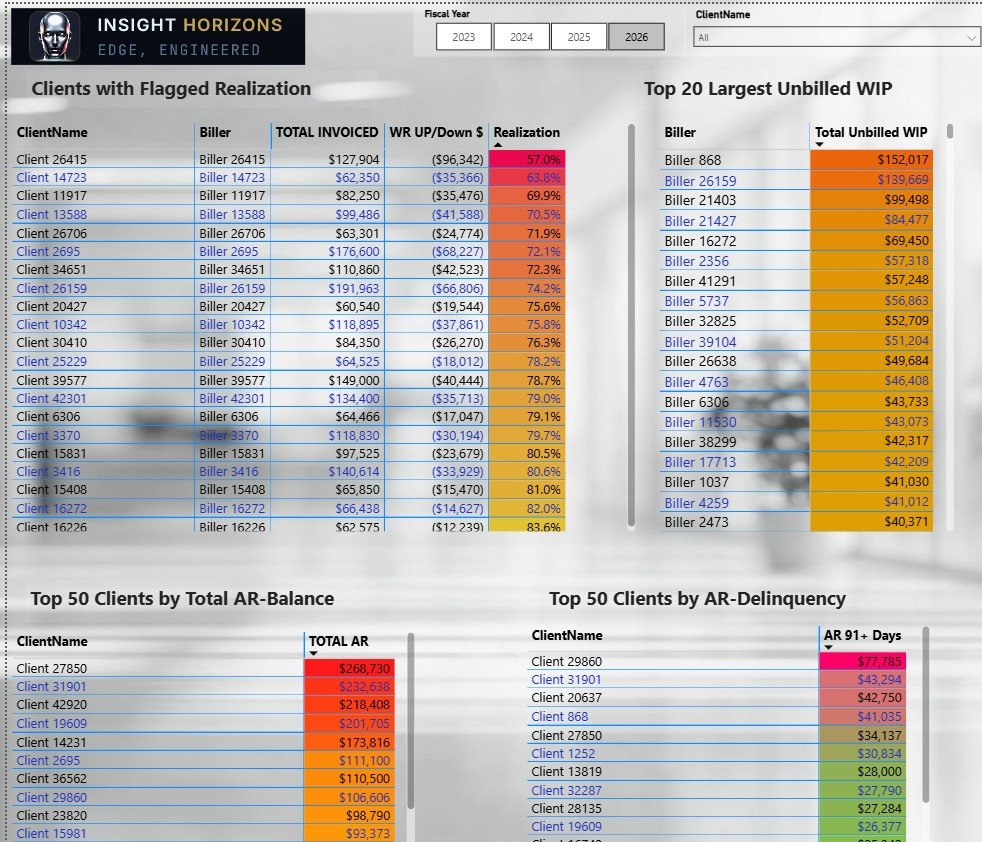
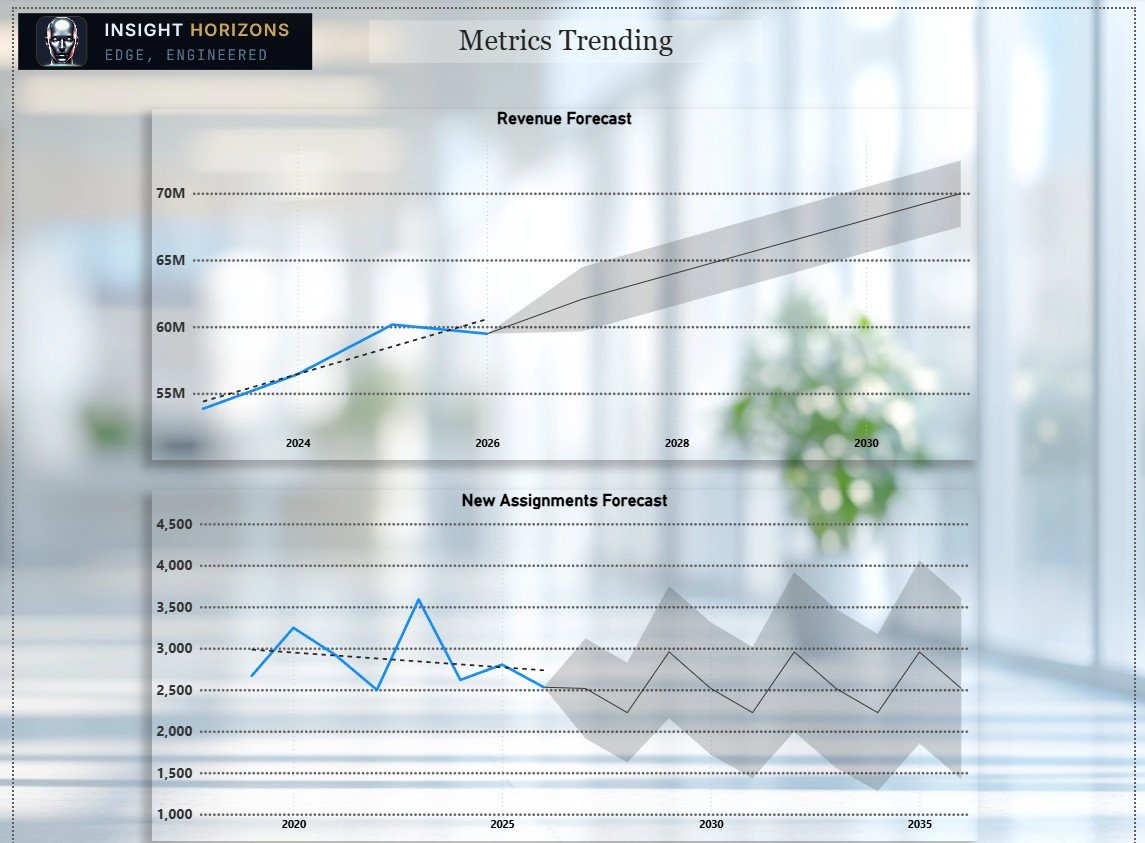
Each view answers questions that leadership currently can't — built on real data, woven into information, and structured into insight. The real magic is the decision-directions that are now enabled and validated.
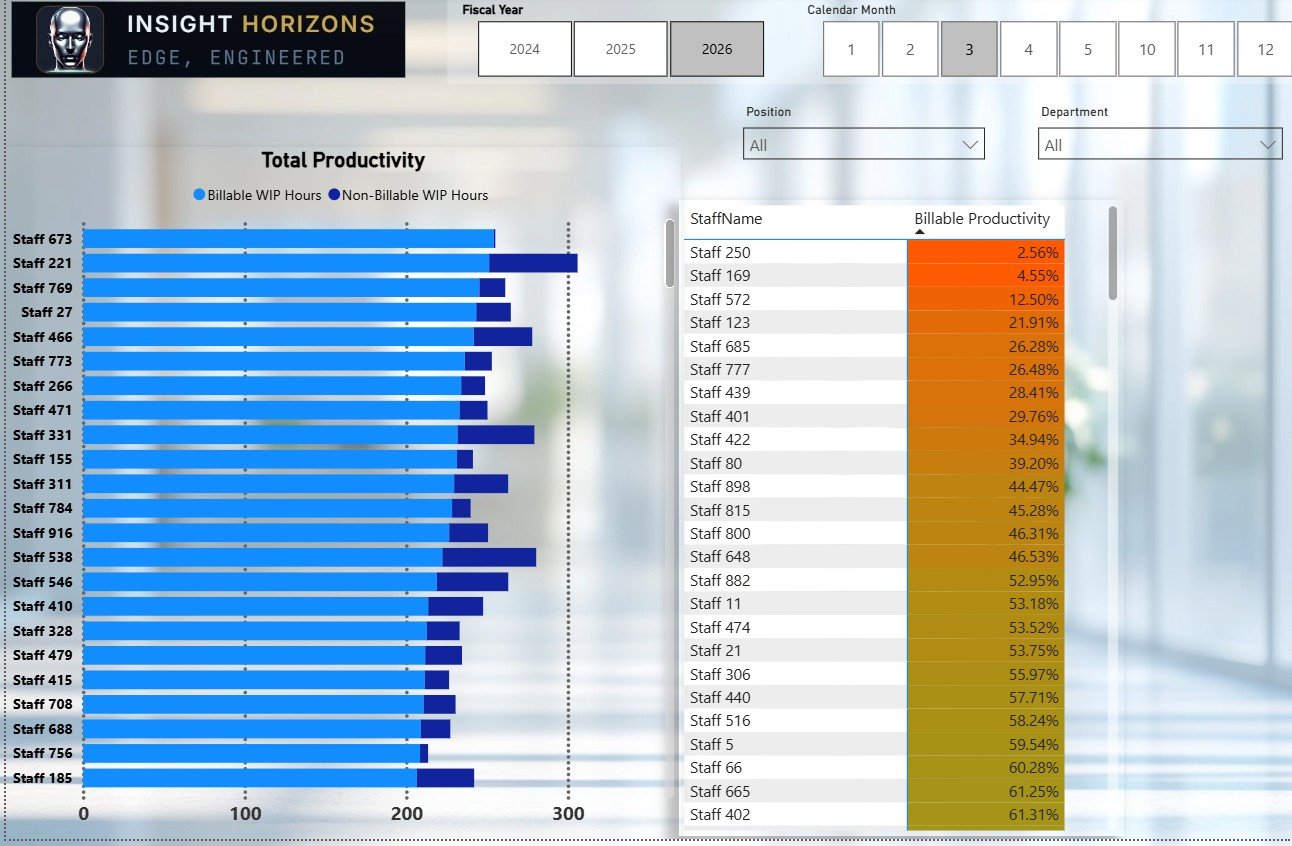
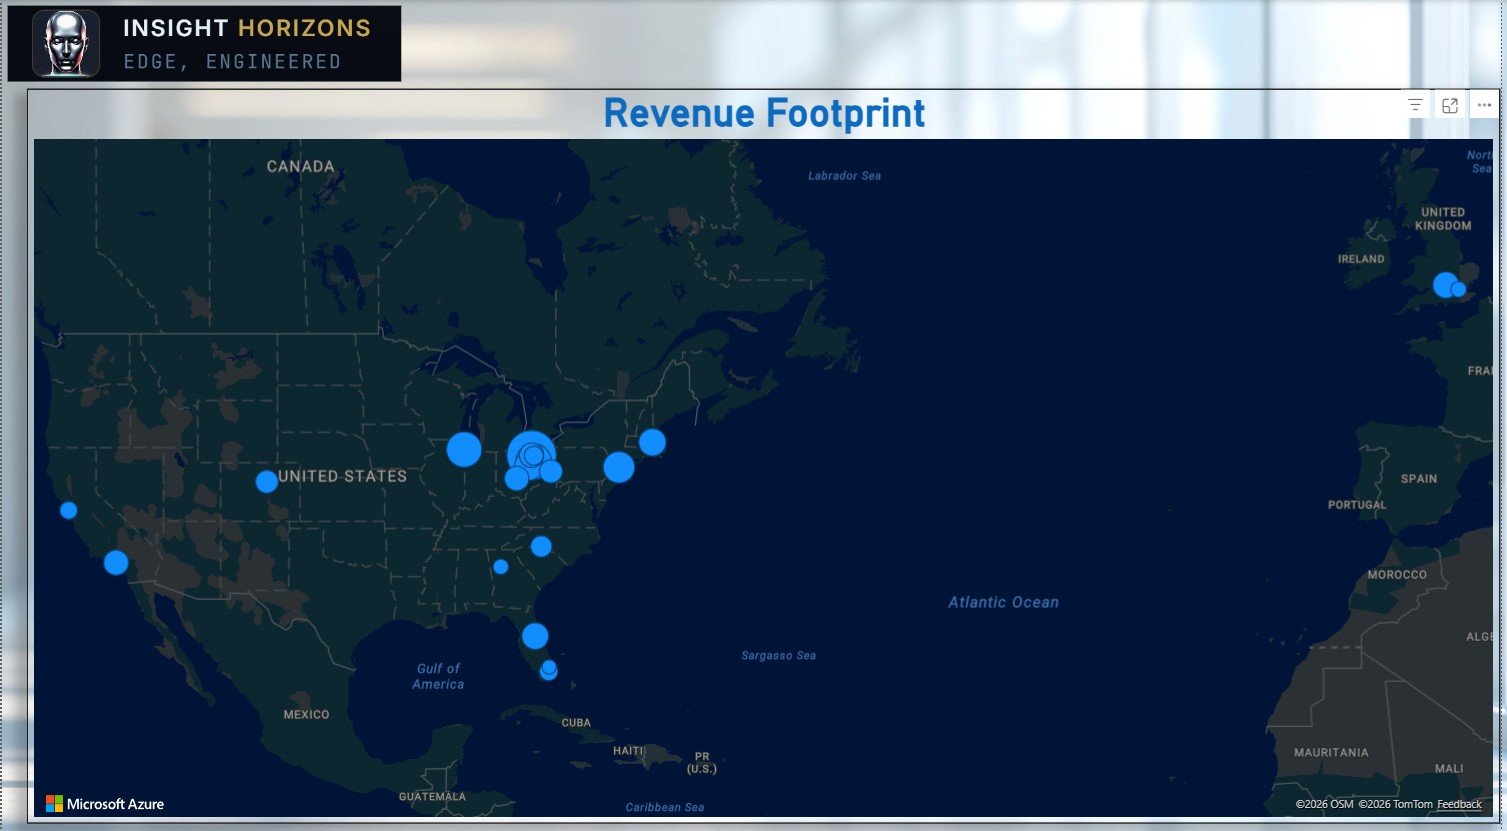
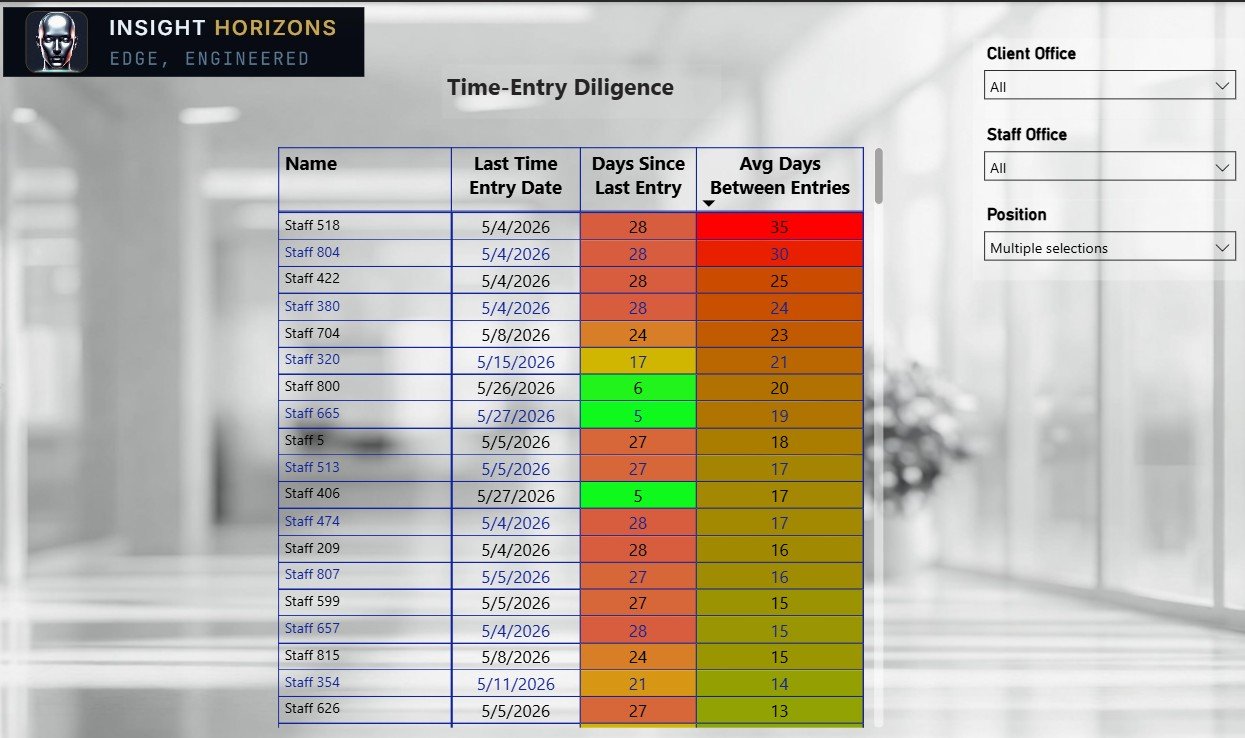
Tearing Down the Curtain: The Diagnostic
Before anyone commits to a build, one fixed, defined engagement: I quantize the first serious location of your Financial Bleed — AR-Aging and Write-Offs, and then map out other potential issues to illuminate through analytic-transformation.
You give me read-only access to your practice-management and billing data. Two weeks later, leadership gets a decision-ready picture — and a prioritized list of what to fix first.
- The first bleed, quantified — your AR aging and write-offs measured in dollars: what's aging, what's slipping to write-off, and what it's costing you now
- A map of what's next — a structured scan of the other usual leak points (realization, WIP, utilization, engagement margin) to surface where the next serious issues likely sit
- A prioritized roadmap — the flagged areas ranked by likely size, so you know where the next, deeper look pays for itself
- A straight answer — a clear, honest read on what's worth pursuing, and what isn't
Scoped. Built. Evolved.
Every engagement is built on your firm's own data — but it starts with one fixed, defined step, so you see the value before you commit a dollar to the build.
The fixed-fee Diagnostic above: I audit your data, find where the money's leaking, and hand leadership a prioritized, ROI-ranked roadmap. You decide what's worth building from there — with the numbers already in front of you.
We build the data pipelines, design the analytical models, and deploy your custom dashboard suite — calibrated to your firm's fiscal calendar, office structure, and decision-making cadence.
Analytics is a living system. As your firm's strategy shifts, we evolve the platform — new views, predictive models, expanded data sources — so the infrastructure compounds in value over time.